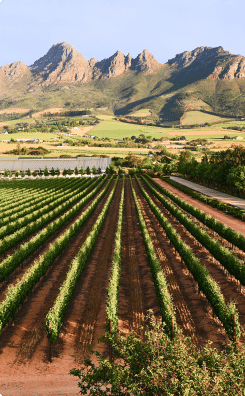
SA’s top 15 varities – trends in plantings
By Christian Eedes, 20 May 2016

6

1. Chenin Blanc – 17 965ha (DOWN by 5.7%)
2. Colombar – 11 839ha (UP by 3.6%)
3. Cabernet Sauvignon – 11 170ha (DOWN by 17.7%)
4. Shiraz – 10 347ha (UP by 5.6%)
5. Sauvignon Blanc – 9 263ha (UP by 20.9%)
6. Pinotage – 7 364ha (UP by 13.4%)
7. Chardonnay – 7 061ha (DOWN by 10.9%)
8. Merlot – 5 939ha (DOWN by 14.5%)
9. Ruby Cabernet – 2 406ha (DOWN by 9.1%)
10. Muscat D’Alexandrie – 1 904ha (DOWN by 27.8%) – fastest faller
11. Cinsaut – 1 863ha (DOWN by 34%)
12. Semillon – 1 152ha (UP by 7.4%)
13. Pinot Noir – 1 120ha (UP by 109.2%) – fastest climber
14. Cabernet Franc – 842ha (DOWN by 12.8%)
15. Viognier – 837ha (UP by 33.1%)
Read more here.


Peter de Wet | 24 May 2016
Regarding the question about Villard Blanc. My neighbour has a block planted and this goes specifically for juice and concentrate. Concentrate is the syrupy stuff that many producers use to sweeten their wines all across the quality spectrum. I doubt much is being made into wine.
Kwispedoor | 24 May 2016
Interesting. It would be great though if winemakers could stop sweetening their wines and just let the post-fermentation residual sugar be the source of any sweetness required.
In particular, adding concentrate to dry wines for a “rounded” mouthfeel is conceited recipe-winemaking and I hope it comes to a swift end.
Which brings me to the question: is it permitted to add concentrate as a sweetener in SA nowadays? If not, then I’m surprised this sort of thing is not done in a more clandestine fashion, as opposed to it being the apparently common and open practice that it is.
Peter May | 23 May 2016
And what about the 4350% increase in plantings of the hybrid Villard Blanc. Jancis has little good to say about it, but suggests its plantings in KZN are because of its tolerance to humidity so maybe none of these these plantings are in the Cape
Peter May | 23 May 2016
Tim asks ‘why is viognier up so much’, – it’s plantings have increased 33.1% in 10 years but I don’t think that’s surprising since it was from a low base, Viognier became very popular and there’s been a big increase in plantings worldwide for use as a varietal and crucially for co-fermentation or blending with Syrah/Shiraz in the Rhone style.
.
.What interets me is the 12.5ha of Grasa de Cotnari (‘a rare Romanian variety’ that has only 450ha planted in Romania and Hungary), and the 3.1ha of Tamioso Romaneas – which isn’t listed in Jancis Robinson but I reckon is a Romanian synonym of Muscat of Hamburg, an ancient table grape, the 2.31 of Grand Noir, and the Beogradska Crna which doesn’t appear in Jancis Robinson.
Also the appearance of hybrids including Chambourcin (which does make a pleasant wine), Villard Noir (which isn’t listed as a producer in Jancis) andVidal Blanc (10ha, why?)
James | 23 May 2016
Tim,
Most of the large decreases relate to smaller plantings like Cinsaut and Cab Franc. That means that small movements in vineyard area translate to much larger percentage movements relative to the larger varieties. If you viewed them as a percentage of total vineyard area those decreases wouldn’t amount to much.
The same applies to the Viognier (+33.1% or 208ha) and Pinot Noir (+109.2% or 585ha).
Also, this is over a 10-year period so a lot of these movements probably make more sense given that time period. For example the Viognier increase amounts to roughly 18ha/year, which is probably explained by the rise of the Cape White Blend category and the rise of Shiraz-led blends (the “SMV” blend in particular).
That said the Cab and Chardonnay declines are large in any context.
Tim James | 20 May 2016
These percentages struck me as extraordinary until I read carefully and realised that you said that, eg, chenin was down BY 5.7% (ie, in its own terms). In fact it was down from 18.6% of the total to 18.2% of the total, which seems much less dramatic! Cabernet was down from 13.4% of the total to 11.3% of the total. These seem to me more meaningful comparisons – but remarkable enough in some cases, like cabernet.
Fascinating figures, which need a bit of unpacking, if possible. Some of them intuitively seem odd – why is viognier up so much, I wonder? I’d guess tha pinot is the champion riser more becasue of plantings destined for sparkling wine than for table wine, but who knows? I suppose, if these figures are to be meaningful, it would be important to know WHERE the plantings are. If, eg, cabernet was mostly uprooted in the Swartland, that might be seen as a positive move, but if it was mostly uprooted in Stellenbosch, that would be depressing.
Mathematically impoverished as I am, it still seems strange to me that more seem to be radically down than up…
As usual, statistics are not worth much until/unless they are usefully explained.