Tim James: All you might want to know about vineyard statistics
By Tim James, 4 July 2022
-
Share:


The question of graciano came up yesterday during the chatty part of our tasting group’s monthly look at foreign wines. Why it did, I can’t remember, as we were tasting serious beaujolais (11 of them, remarkably rewarding, especially six Morgons from Daniel Bouland), which is made from gamay; and graciano is a minor but high quality grape most associated with Rioja in northern Spain. A little graciano was grown in the Cape, we knew – Nederburg had included it in the Spanish Red that was part of the fairly shortlived Ingenuity range (the White was excellent, the reds too big and over-everything for my taste).
None of us knew any more about local plantings of graciano than that, but Chris Williams of The Foundry said that he’d for a while been wanting to get hold of some of the grapes. So, later, I turned to the statistics on viticulture compiled and published by Sawis (the indispensible and excellent South African Wine Industry Information and Systems team), the latest tranche of which recently became available on their website. From the overview booklet on “Status of Wine-grape Vines as on 31 December 2021” I learned that local plantings of graciano had increased from a mere 1.51 hectares in 2011 to 10.41 ha now (ok, that’s still pretty “mere”). And from the “Vines in SA’s Wine of Origin Regions 2021 (Sultana included)” Excel spreadsheet, I found that graciano is grown in Groenekloof, Paarl-Simonsberg, Voor Paardeberg, Wellington and Paarl (no ward). Those must be pretty small plantings to total just over 10 ha. But isn’t it impressive to have this sort of up-to-date information so easily and freely available?
So much for graciano, about which plantings we now all know much more than seems useful – except to Chris Williams, who’ll be following up with Sawis and then trying to get hold of some grapes to vinify, which is undoubtedly an interesting prospect if it comes to pass). But there is a great deal more available about vineyards, giving insight into the shape of the South African wine industry. Other industry aspects, together with some of the vine stuff of course, are covered in the general booklet, “South African Wine Industry Statistics 2021”, also just released on the Sawis website – providing material with which no doubt I will want to bore or enthrall you fairly soon, if you don’t want to digest it yourself.
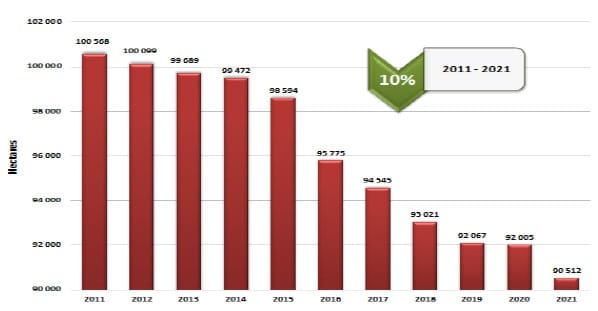
The most important statistical information, in my opinion, comes at the macro scale (where the likes of graciano scarcely register), comparing the size of the SA vineyard with the size of the crop. The bar-chart shown here indicates the 10% decline in the area planted to wine-grape vines since 2011: from over 100 000 ha then to 90 512 now. Almost certainly the number will fall below 90 000 by the end of this year. Frankly, that’s not a problem if it is poorer vineyards being pulled out and replacd with wheat or lemons or grazing or whatever. What is concerning (as I’ve argued before) is that, as the general Sawis booklet reveals, the crop continues to grow even while the vineyards decline – showing how much harder the vines (which are also growing older overall, as the statistics show, and therefore less productive after a point) are being pushed to work.
But what we have in the Sawis compilations is, of course, just the statistics. It is up to others to draw conclusions and, no doubt, argue over them.
The Sawis Status of Wine-grape Vines publication shows graphic charts of how the different regions are affected by vineyard reductions. As to the varieties affected, there is a lengthy table showing plantings for all the permitted varieties. (Incidentally, the white:red balance has remained essentially stable for a long time at 55:45%.) Chenin blanc remains at the head of the list – but no longer quite as overwhelmingly so as it once was. From 2011 to 2021 hectarage declined from 18 324 to 16 827. Second-placed colombar has also had a big drop (the poorly performing brandy industry perhaps nudging these two stalwarts down?) and is now closely pushed by sauvignon blanc – one of very few major grapes to have increased its plantings.
Both colombar and sauvignon have overtaken cabernet, which was in second position a decade back – whether its decline has been in quality areas like Stellenbosch or more dubiously suitable ones like Breedekloof and Stellenbosch, the presented statistics don’t show, though I dare say one could dig them out of Sawis’s voluminous records.
Pinotage, in sixth position, behind cab and syrah, is the only other of the top-ten varieties to have expanded its surface area – but by a minuscule amount. It is followed by chardonnay, merlot, ruby cabernet, and cinsault. At 12th position, pinot noir has also grown (mostly for bubbly, I suspect), as has petit verdot at 16, and malbec at 18; grenache noir, I’m pleased to note, has more than doubled its hectarage to 518, putting it firmly in the top 20. Durif/petite sirah also had a massive percentage increase – to 358 ha, at position 23.
In fact, going down the list (to poor old Schoneburger at 112th place, whose 0.32 ha of vines have now all been pulled out), there are some interesting and welcome names that weren’t there a decade ago: vermentino, nero d’avola, gruner veltliner, marselan, assyrtiko, llandoner pelut, piquepoul, agiorgitiko, grillo … and others. Many of these should show healthy growth over the next decade, especially those that will be useful in the hotter, drier climate we should be planning for. But statistics themselves don’t have opinions about such matters – though they can reflect the consequential actions of grapegrowers that do.
As to the distribution of those hectares, according to the “information regions” listed by Sawis, Stellenbosch leads with 14 933 ha, closely followed by Paarl. But it must be noted that there is an unfortunate and irritating persistence in including Constantia, Durbanville and the other Cape Town-ish wards within Stellenbosch; while Franschhoek and Wellington are included within Paarl.) The smallest of these information regions are Klein Karoo and (a little larger) Cape South Coast, both smaller than Northern Cape. But if you add together Robertson, Breedekloof and Worcester, you see how dominant the hot, irrigated Breede River Valley is in South African wine: their joint 31 859 ha is more than a third of the national total. Swartland has 12 333 ha (just less than Robertson and Breedekloof individually). Olifants River at 8 783 ha, between Swartland and Worcester.
There are a few of the stats, then. And numbers aren’t all, of course – but they do offer a good starting point for all sorts of thoughts, as well as clues for Chris Williams to use when trying to source graciano.
- Tim James is one of South Africa’s leading wine commentators, contributing to various local and international wine publications. He is a taster (and associate editor) for Platter’s. His book Wines of South Africa – Tradition and Revolution appeared in 2013.
-
Share:

Related articles
Opinion & Analysis
Tim James: A handful of reds under R175 – with a few triumphs
22 June 2026
I could say that this little exercise was purely because I thought there must be people out there who’d welcome some recommendations at comfortably below R200, willing to slum it...

14
Opinion & Analysis
Tim James: Why Kleine Zalze deserves a second look
15 June 2026
Looking back at the last time I visited and wrote about Kleine Zalze, in 2020, I find I had a thought that I have this time modified a little. It’s...
Opinion & Analysis
Tim James: Something stirs at Platter’s – but to what end?
2 June 2026
In a recent article, Christian Eedes remarked (somewhat cheekily) that “the much-loved Platter’s guide now appears to be nearing the end of a glorious 46-year run”. The recently appointed GM...
Comments
0 comment(s)
Please read our Comments Policy here.