Malu Lambert: New map links Swartland geology to wine styles
By Malu Lambert, 1 October 2025
-
Share:


4
“We didn’t want another pretty poster by a cartographer,” says well-known viticulturist Jaco Engelbrecht in his characteristically direct manner. “This map links geology to viticulture and actual pockets of wine styles. Most maps are either created by geologists in a lab with no dirt under their fingernails, or designers who love aesthetics. This one’s created by actual farmers.”
This conversation is beaming out from Eben Sadie’s Rotsbank farm into my lounge in Noordhoek. It’s early morning. Sadie and Engelbrecht nurse cups of coffee, the vaulted ceiling of the cellar rising in the background.
“We’ve built a soil map,” Sadie emphasises. “It’s not about marketing, it’s a working document for us to study and populate with accurate information. Hopefully it will help pave the way to a deeper understanding of what this remarkable place is all about.”
The map, titled The Impact of Swartland’s Geology on Wine Styles: A Map-Based Analysis, is available in high resolution from the Swartland Wine and Olive Route website for R650. The initiative has been painstakingly put together by Engelbrecht and Sadie over a period of two years of “very late nights” with “minimal financial backing”.
“Normally you see a ton of sponsor logos at the bottom of a map,” points out Sadie, alluding to how other more moneyed regions benefit from institutional support, whereas this initiative has been entirely self-financed.
As publicised as it is, the vast Swartland continues to be something of an enigma. It’s South Africa’s largest wine district in terms of surface area (the fifth most planted to vines). The boundaries stretch approximately 999,000 hectares, from the Atlantic coast to inland mountains, patchworked with wheatfields and bushvines in between. The sheer scale and complexity make the district difficult to grasp, a constant frustration for producers trying to explain it.
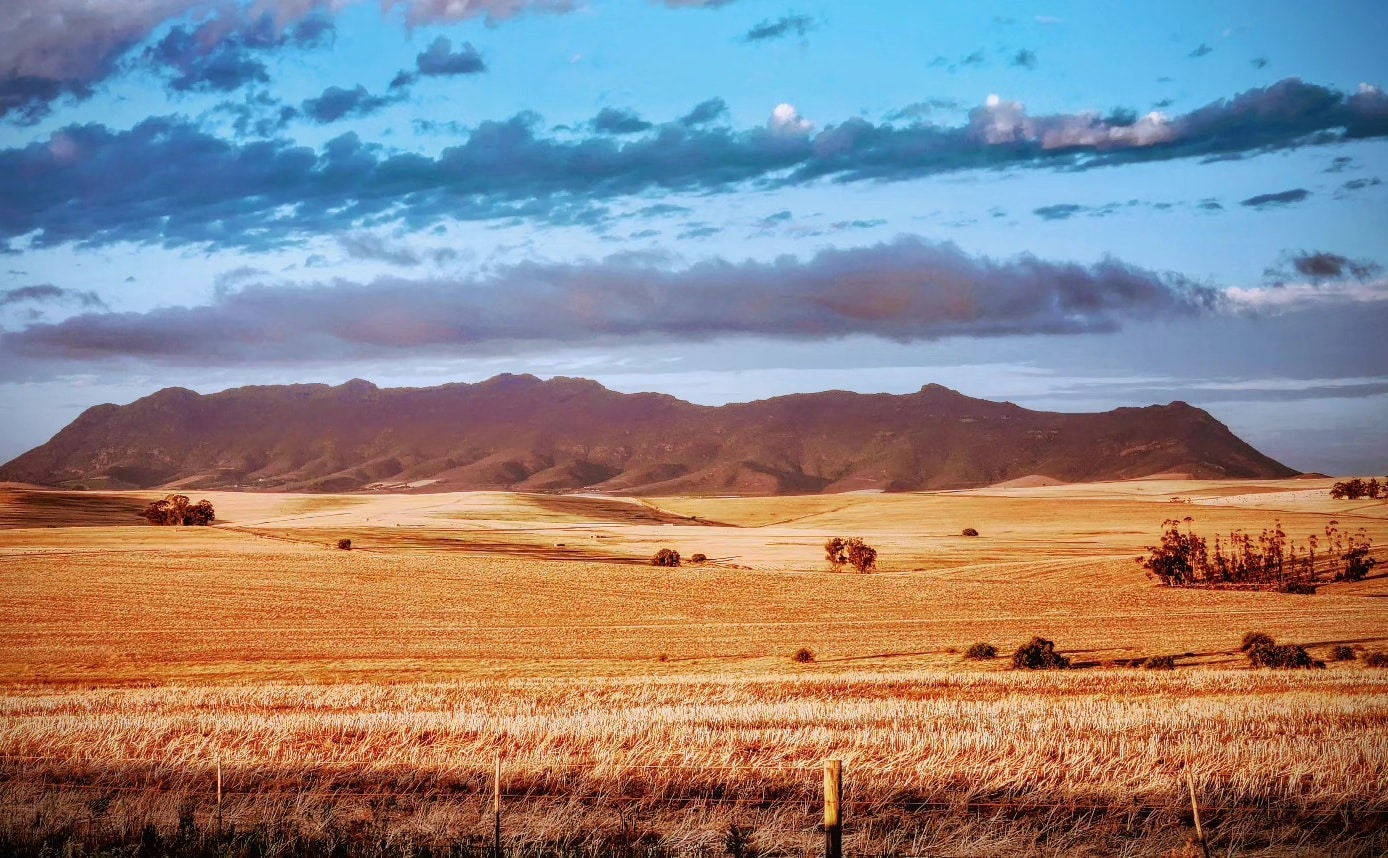
“Journalists still call it flat,” says Sadie, shaking his head. “It’s one of the most mountainous wine regions in South Africa. Size breeds diversity: increased surface area means increased anomalies.”
The map is a means to bring clarity. Burgundy and Bordeaux have been mapped, scrutinised and revised for centuries. That intimacy of understanding is part of the allure of these places. It arms wine geeks with the confidence to pontificate on the link between limestone soils and high acids. Ask any scholar, maps are the bedrock of wine education.
In the process they uncovered nearly 700 geological polygons, which is to say a map key that indicates an area with uniform soil structure, though it may contain several. These were simplified to connect parent rock to vineyard expression.
Why create the map now? “The Swartland has come of age,” says Sadie simply, explaining that over the past two decades the region has expanded massively in focus, with new producers, new sites, new varieties. “Such a map couldn’t have been made earlier. You need time to show a cohesive stylistic DNA. Vintages building on each other, winemakers learning their parcels, styles consolidating into something recognisable.”
The need, he argues, has become more acute. For years the Swartland has been defined more by personality than by place. Wards exist on paper, but they don’t always connect clearly to what’s in the glass. What matters more is soil, slope, and geology, factors that cut across ward boundaries. “This map seeks to capture that truth: not a bureaucratic grid, but a practical tool linking terroir to wine identity.”
It is, by any measure, an ambitious undertaking. Distilling such diversity into something legible is no small task. The goal is a living framework that grows as the region itself evolves. Once that dynamic is in place, the pair believe the Swartland can finally tell its story with both confidence and cohesion.
Some discoveries from the masterwork include that much of the Swartland is defined by lean soils with clay content under 15%. To the west, above Malmesbury and the R45, clay levels rise to 15–35%, shaping a different profile of vineyard potential.
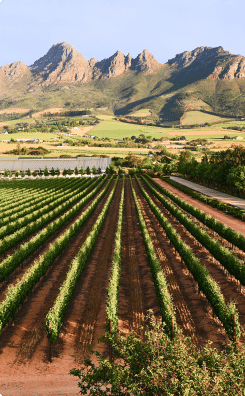
At the heart of the region lies the Malmesbury Group, a formation that stretches in a broken belt of mountains from Cape Town up to Piketberg. Its bedrock, greywacke, phyllite, quartz schist, and pockets of limestone pushes up into foothills and ridges around Malmesbury, the Riebeek Valley, Moorreesburg and Piketberg. These soils are considered among the Cape’s finest.
Magma once surged through the Swartland, cooling into granite outcrops that today form the Paardeberg, while later shifts overlaid parts of the region with sandstone from the Cape Supergroup. The Paardeberg rising nearly 700 metres is dotted with massive dolerite boulders. The Kasteelberg and Piketberg, by contrast, stand as sandstone survivors, their peaks reaching between 1000 and 1300 metres. The shale-based rises of Malmesbury and Porseleinberg climb more modestly, 200 to 400 metres, but remain crucial landmarks in the Swartland’s patchwork of soils and elevations.
An example of linking style to place is the Paardeberg’s granite; whites from here often show clarity and bright acidity. The reds, fine tannins with a chiselled structure.
Sadie notes that the local culture of vinification helps make these expressions clearer. Few producers use new oak; instead, many wines are bottled with minimal intervention. “Regional tastings show it clearly, the absence of oak overtones allows the nuance of each micro-terroir to emerge more quickly.”
That ethos, Sadie explains, has been crucial in decoding site expression. With wines presented transparently, without the gloss of heavy cellar work, it’s possible to map how soil and slope overlap with flavour and texture. “The information in the glass feels true, a direct translation of geology into wine.”
The ambition is writ large. Plans include making the map interactive, printing it in 3D, there’s talk of an app. Most importantly, Sadie stresses, they want this level of mapping for the entire country. “The industry should back it, then take it national. Otherwise we’ll argue on Instagram while nothing happens.
“Just picture it: one geological thread defining the Cape. We would finally send a unified message to the world. After all, rising tides lift all boats.”
- Malu Lambert is a freelance wine journalist and wine judge who has written for numerous local and international titles. She is a WSET Diploma alum and won the title of Louis Roederer Emerging Wine Writer of the Year 2019, among many other accolades. She sits on various tasting panels and has judged in competitions abroad. Follow her on X: @MaluLambert
-
Share:

Comments
4 comment(s)
Please read our Comments Policy here.
Leave a Reply to RUDI KOTZE Cancel reply
Related articles
Opinion & Analysis
Malu Lambert: Uprooted – why SA vineyards are disappearing
6 August 2025
“Not known, because not looked for / But heard, half-heard, in the stillness / Between two waves of the sea.” Quoting T.S. Eliot, Jonathan Steyn, convener of UCT GSB's Business...
Opinion & Analysis
Malu Lambert: Urbanisation – a growing threat to viticulture
2 June 2025
A year ago I stood with Christo le Riche outside his Helderberg winery taking in the sight of newly planted cabernet sauvignon, the first for them. Since Le Riche was...
1
Opinion & Analysis
Malu Lambert: Where wine people eat
3 February 2025
Though it’s been open since 1987, I only recently (very much) enjoyed my first lunch at Decameron in Stellenbosch. Named for a 14th-century collection of short stories by Giovanni Boccaccio,...
Kwispedoor | 2 October 2025
My map is on its way. Can’t wait to check it out up close!
RUDI KOTZE | 2 October 2025
Awesome idea.
Gareth | 2 October 2025
Isn’t Eben’s farm called Rotsvas? Rotsbank is the name of one of his vineyard sites and the wine that is made from it.
Otherwise, great article and I love the concept.
Christian Eedes | 3 October 2025
You are entirely correct!